Charts are the backbone of any data-driven PowerPoint presentation. They make your message clearer and more persuasive. But when chart editing doesn’t go as planned, it can quickly derail your workflow and weaken your impact. Little problems with Excel, like formatting or syncing, can soon become major annoyances. We’ll show you how to edit chart in PowerPoint, including organizational charts, pie charts, flow charts, and any type of charts. Start to learn how to edit tables in PowerPoint and make better slides in no time.

- On This Page
- How to Edit an Organizational Chart in PowerPoint?
- How to Edit a Pie Chart in PowerPoint?
- How to Edit a Flow Chart in PowerPoint?
- How to Change Chart Design in PowerPoint?
- Enhance Your PowerPoint with Vidwud AI PowerPoint Generator
How to Edit an Organizational Chart in PowerPoint?
Once you've inserted an organizational chart in PowerPoint, customizing it to reflect your team structure is straightforward. Follow the guide below on how to edit organizational chart in PowerPoint.
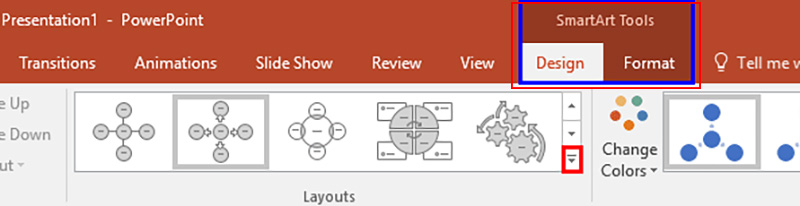
Step 1. Click on the organizational chart to activate the SmartArt tools. This will open two new tabs: Design and Format under SmartArt Tools.
Step 2. Go to the Design tab and use the Add Shape button to insert new positions. Choose where to place them - Above, Below, After, or Before - depending on your desired hierarchy. To remove a position, simply select it and press Delete.
- Click directly on each shape to enter or update names and job titles. You can also use the Text Pane on the left to make changes quickly.
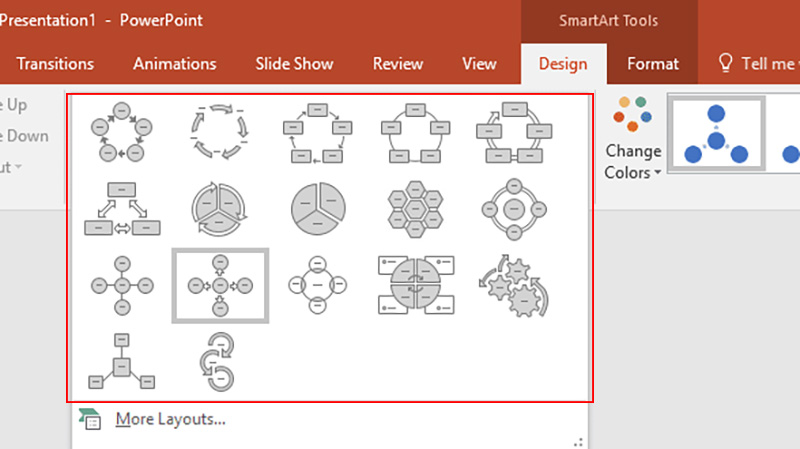
- Adjust the chart layout using the Layouts group in the Design tab. Choose a more compact, horizontal, or vertical arrangement as needed. Use Styles to change colors and design elements as you want.
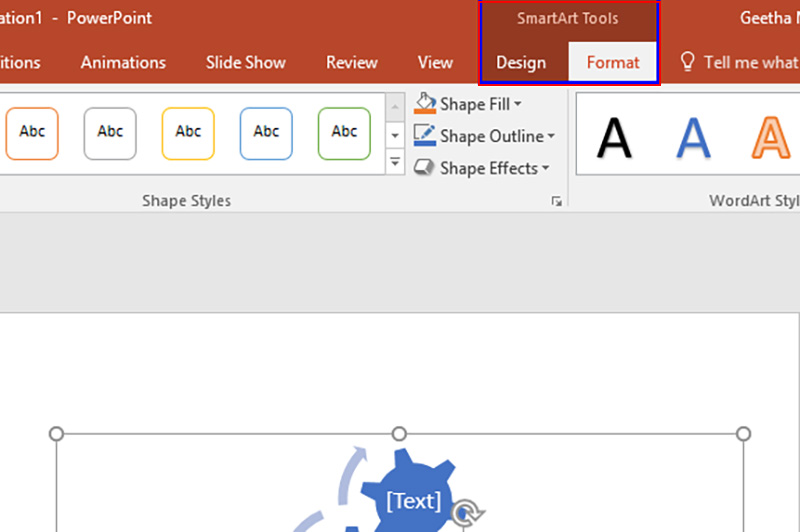
Step 3. Use the Format tab to manually resize, align, or reposition individual boxes for better clarity and spacing.
How to Edit a Pie Chart in PowerPoint?
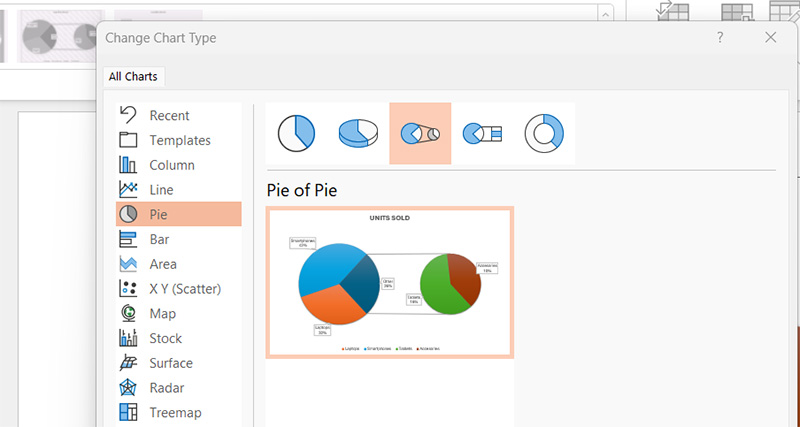
How to edit a chart in PowerPoint if it’s a pie chart? For the pie chart in PowerPoint, you can update values, change colors, adjust the layout, etc. Learn how to edit chart data in PowerPoint with the following steps.
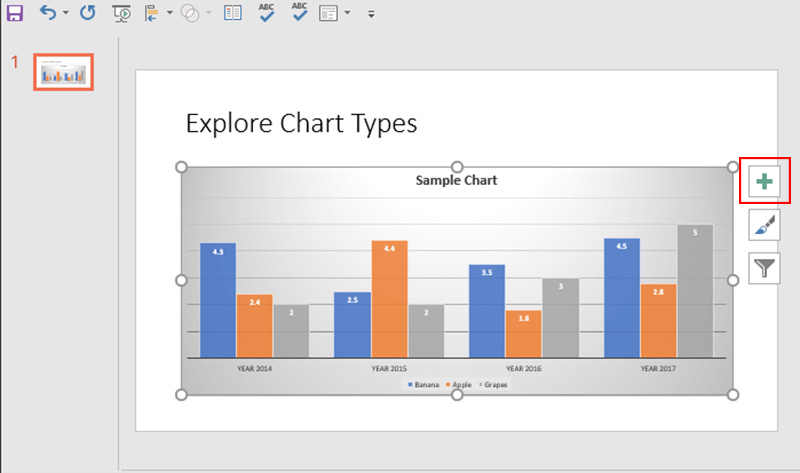
Step 1. Click on the pie chart to activate the Chart Design. Changes you make here will instantly update the chart.
Step 2. Still, in the Design tab, browse through the available Chart Styles or select Change Colors to match your presentation's visual style.
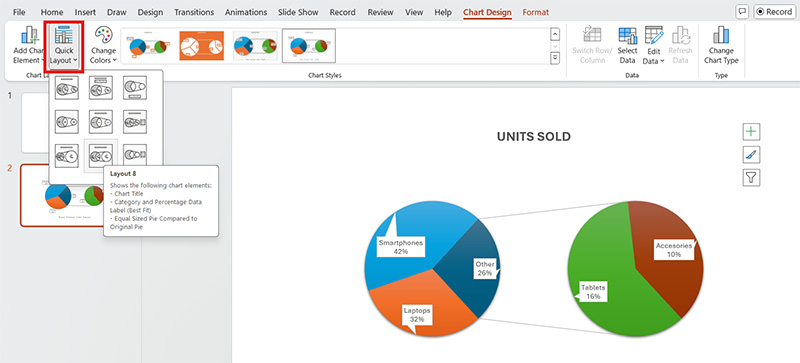
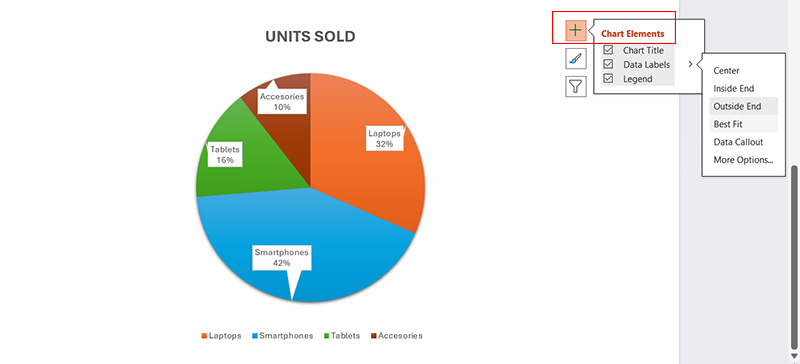
Step 3. How to edit chart data in PowerPoint? Click the “+” icon next to the chart to toggle elements like the chart title, data labels, legend, and more.
Also Read: Best 5 AI Online Presentation Makers to Create Stunning PPTs
How to Edit a Flow Chart in PowerPoint?
How to edit chart in PowerPoint for flow charts? You may need to modify it quite often to better represent your workflow or process in your presentation. Here’s how to edit tables in PowerPoint effectively.
Step 1. Click on the flow chart to open the SmartArt Design tools.
Step 2. Go to the Design tab and select Add Shape. You can insert a shape After, Before, Above, or Below the selected one to reflect changes in the process. Edit text inside each shape directly.
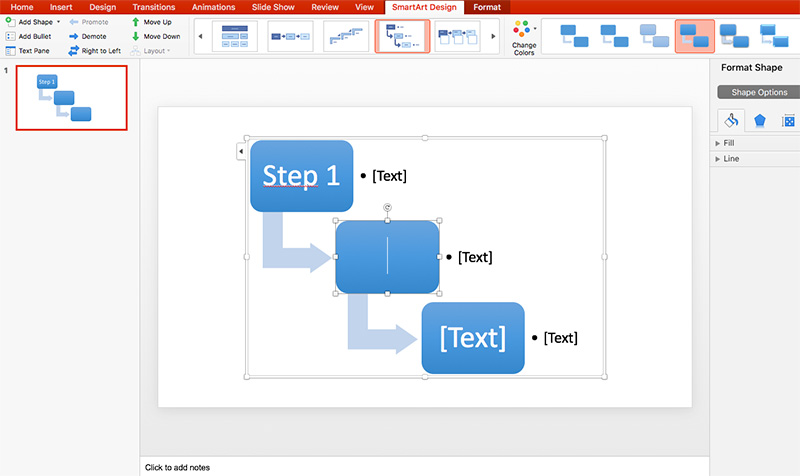
Step 3. Click on a shape and start typing, or use the Text Pane on the left for quicker edits and better structure visibility.

Tips: Customize the layout and appearance. Use the Layouts and Change Colors options under the Design tab to reorganize and restyle your chart. The Format tab offers more adjustments like resizing, shape styles, alignment, etc. for flow charts.
Also Read: 7 Best Presentation Sites for Stunning Slides in 2025
How to Change Chart Design in PowerPoint?
How to edit chart in PowerPoint if the design is disappointing? PowerPoint also comes with lots of design options. Learn how to edit chart data in PowerPoint with more appealing design. If you've already lost patience trying these steps, learn how to create a presentation with AI.
Step 1. Activate chart tools by clicking on the chart. Design and Format tabs on the ribbon should be revealed.
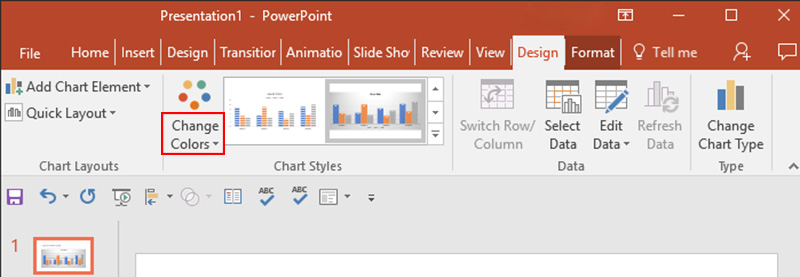
Step 2. Select a new chart style. Under the Design tab, browse through the Chart Styles gallery to find a pre-set style with different colors, effects, and layouts. How to edit chart data in PowerPoint? You can also select data, edit data, and refresh data under the Design tab.
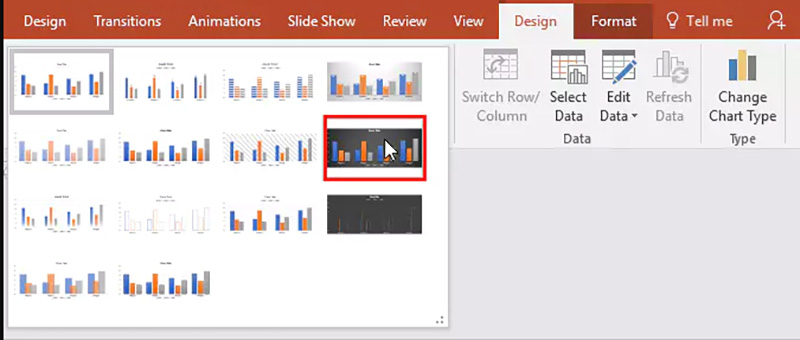
Step 3. Click Change Colors in the Design tab to switch the color palette of your chart. Choose a color set that fits your slide theme or highlights key data.
Step 4. Modify chart layout elements. Use the Chart Elements button (the “+” icon) to add, remove, or reposition labels, legends, and titles to enhance clarity and focus.
Enhance Your PowerPoint with Vidwud AI PowerPoint Generator
How to edit chart in PowerPoint without manual formatting? Just quit it and try an AI PowerPoint generator. Creating a professional presentation no longer requires hours of formatting or design skills - Vidwud AI PowerPoint Generator makes the process incredibly efficient.
Free AI Presentation Maker - Text to PPT
-
Easy and free prompt-to-slideshow generator
-
Multiple themes & templates for beautiful PPT creation
- Perfect online slideshow for school project, business pitch, etc.
Make AI Presentation Now
With Vidwud AI PowerPoint Generator, you can generate slides in just 1–2 minutes. Whether you're preparing a school project, team presentation, or sales pitch, Vidwud helps create stunning presentations automatically from a simple text prompt. With features like one-click slide creation, a vast media library, customizable templates, and consistently high-quality output, Vidwud eliminates the hassle of manual design work and saves users time and effort.
Now, you don’t have to trouble yourself with learning how to edit chart in PowerPoint. Follow this simple guide to turn your ideas into slides with the AI chart generator.
Step 1. Open the Vidwud AI PowerPoint Generator.
Make AI Presentation Now
Step 2. Enter a clear description of your topic into the prompt field. For instance, type something like “An introduction to time management strategies for students.”

Step 3. Choose your preferred number of slides, the use case (e.g., education, business, team meeting), and your output language.

Step 4. Click on “Create Free Slides Now” to generate a basic outline. You can edit the structure, remove unwanted slides, or adjust the content before moving forward.

Step 5. Pick a design theme that matches your presentation style. Hit “Generate Now” and let Vidwud do the work of building your full slide deck.
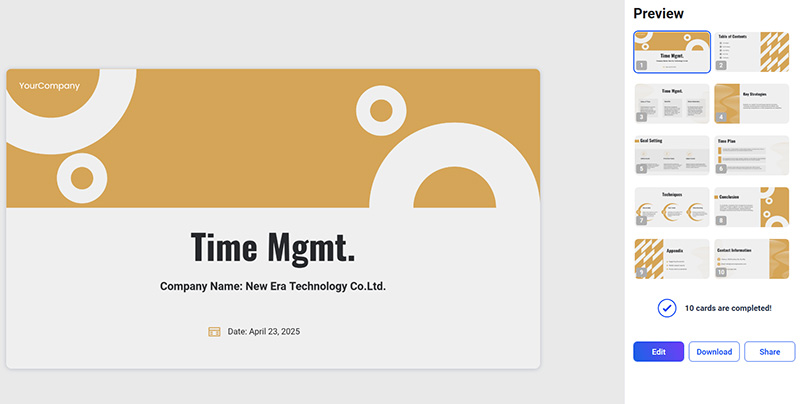
Step 6. Once your presentation is ready, you can make final edits using the built-in editor or simply download the file in PPTX format for offline use or sharing.
The Bottom Line
It’s not difficult to learn how to edit chart in PowerPoint, be it an organizational chart, pie chart, flowchart, or data chart. You can adjust layouts, add visual elements like shapes, and update data in charts to communicate your ideas effectively. However, when you're short on time or starting from scratch, manually editing or building slides can still be overwhelming.
That’s why Vidwud AI PowerPoint Generator is designed. Instead of spending hours on formatting, design, or structure, you can generate a well-polished and professional presentation in just a few clicks. Don’t let slide creation slow you down, try Vidwud’s AI powerpoint generator from text, create free slides now, and experience the smarter way to present.
Free AI Presentation Maker - Text to PPT
-
Easy and free prompt-to-slideshow generator
-
Multiple themes & templates for beautiful PPT creation
- Perfect online slideshow for school project, business pitch, etc.
Make AI Presentation Now


![Top 5 AI PPT Editors to Generate & Edit PPT with AI [2025]](https://cdn.vidwud.com/blog_files/20250124/ai-ppt-editor.jpg)
